Preprocessing Demo#
In this notebook, we will explore downloading and preprocessing a multisample spatial transcriptomics dataset for analysis with Popari. In particular, we will be working with a dataset profiling the progression of Alzheimer’s Disease (AD) in mouse brain tissue.
from pathlib import Path

import numpy as np
import pandas as pd
from scipy.sparse import csr_matrix

from matplotlib import pyplot as plt

import anndata as ad
import scanpy as sc
import squidpy as sq

from popari.components import PopariDataset
from popari.io import save_anndata, load_anndata
Load data#
Here we load the raw data. This process will vary considerably from dataset to dataset, as there is no standard data format for the outputs of spatial transcriptomics assay. However, generally the expression data and spatial coordinate information will be available in two separate files.
data_directory = Path("/work/magroup/shahula/spatiotemporal_transcriptomics_integration/data/STARmapPlus/SCP1375/")
Load raw expression#
dataset_path = data_directory / "expression" / "expression_matrix_raw.csv"
raw_expression = pd.read_csv(dataset_path)
Load spatial coordinates#
eight_month_coordinates = pd.read_csv(data_directory / 'cluster' / 'spatial_8months-disease-replicate_1.csv', header=0, skiprows=lambda x: x == 1)
thirteen_month_coordinates = pd.read_csv(data_directory / 'cluster' / 'spatial_13months-disease-replicate_1.csv', header=0, skiprows=lambda x: x == 1)

spatial_info = [
    eight_month_coordinates,
    thirteen_month_coordinates
]

dataset_names = [
    'eight_month',
    'thirteen_month',
]
From viewing the raw expression dataframe, we can see that there are many 1s and 0s.
raw_expression
| GENE | 1 | 3 | 4 | 5 | 6 | 7 | 8 | 9 | 10 | ... | 76834 | 76836 | 76837 | 76838 | 76839 | 76840 | 76842 | 76843 | 76845 | 76846 | |
|---|---|---|---|---|---|---|---|---|---|---|---|---|---|---|---|---|---|---|---|---|---|
| 0 | A2m | 0.0 | 0.0 | 0.0 | 0.0 | 0.0 | 0.0 | 0.0 | 0.0 | 0.0 | ... | 0.0 | 0.0 | 0.0 | 0.0 | 0.0 | 0.0 | 0.0 | 0.0 | 0.0 | 0.0 |
| 1 | Aagab | 0.0 | 0.0 | 0.0 | 0.0 | 1.0 | 0.0 | 0.0 | 0.0 | 0.0 | ... | 0.0 | 0.0 | 0.0 | 0.0 | 0.0 | 0.0 | 0.0 | 0.0 | 0.0 | 0.0 |
| 2 | Aak1 | 0.0 | 0.0 | 0.0 | 0.0 | 0.0 | 0.0 | 0.0 | 0.0 | 0.0 | ... | 0.0 | 0.0 | 0.0 | 0.0 | 0.0 | 0.0 | 0.0 | 0.0 | 0.0 | 0.0 |
| 3 | Abca2 | 0.0 | 0.0 | 0.0 | 0.0 | 0.0 | 0.0 | 0.0 | 0.0 | 0.0 | ... | 0.0 | 0.0 | 0.0 | 0.0 | 0.0 | 0.0 | 0.0 | 0.0 | 0.0 | 0.0 |
| 4 | Abca7 | 0.0 | 1.0 | 0.0 | 0.0 | 0.0 | 0.0 | 0.0 | 0.0 | 0.0 | ... | 0.0 | 0.0 | 0.0 | 0.0 | 0.0 | 0.0 | 0.0 | 0.0 | 0.0 | 0.0 |
| ... | ... | ... | ... | ... | ... | ... | ... | ... | ... | ... | ... | ... | ... | ... | ... | ... | ... | ... | ... | ... | ... |
| 2761 | Zhx1 | 0.0 | 0.0 | 0.0 | 0.0 | 1.0 | 0.0 | 0.0 | 0.0 | 0.0 | ... | 0.0 | 1.0 | 0.0 | 1.0 | 0.0 | 0.0 | 0.0 | 0.0 | 0.0 | 0.0 |
| 2762 | Zic1 | 1.0 | 0.0 | 0.0 | 0.0 | 0.0 | 0.0 | 0.0 | 0.0 | 1.0 | ... | 0.0 | 0.0 | 0.0 | 0.0 | 0.0 | 0.0 | 0.0 | 0.0 | 0.0 | 0.0 |
| 2763 | Zim1 | 0.0 | 0.0 | 0.0 | 0.0 | 0.0 | 0.0 | 0.0 | 0.0 | 0.0 | ... | 0.0 | 0.0 | 0.0 | 0.0 | 0.0 | 0.0 | 0.0 | 0.0 | 0.0 | 0.0 |
| 2764 | Zmym1 | 0.0 | 0.0 | 0.0 | 0.0 | 0.0 | 0.0 | 0.0 | 0.0 | 0.0 | ... | 0.0 | 0.0 | 0.0 | 0.0 | 0.0 | 0.0 | 1.0 | 0.0 | 0.0 | 0.0 |
| 2765 | Zmym2 | 0.0 | 0.0 | 0.0 | 0.0 | 0.0 | 0.0 | 0.0 | 0.0 | 1.0 | ... | 0.0 | 0.0 | 0.0 | 1.0 | 0.0 | 0.0 | 0.0 | 0.0 | 0.0 | 0.0 |
2766 rows × 72166 columns
Reformat#
Here we reformat the raw data into AnnData objects.
def reformat_dataset(spatial_metadata, raw_dataframe):
    # Reformatting
    spatial_metadata['X'] = spatial_metadata['X'].astype('int')
    spatial_metadata['Y'] = spatial_metadata['Y'].astype('int')
    idx = spatial_metadata['NAME'].astype(str)

    raw_values = raw_dataframe.loc[:, idx]

    dataset = ad.AnnData(csr_matrix(raw_values.T.values), dtype=np.float64)
    dataset.obs_names = [f"Cell_{i:d}" for i in range(dataset.n_obs)]
    dataset.var_names = [raw_dataframe['GENE'].iloc[i] for i in range(dataset.n_vars)]\

    dataset.obsm['spatial'] = spatial_metadata[['X', 'Y']].values

    return dataset
reformatted_datasets = [reformat_dataset(spatial_metadata, raw_expression) for spatial_metadata in spatial_info]
Data transformation#
To match the Popari probabilistic model, we transform the raw count data such that the data is better approximated by a truncated Gaussian; this is accomplished by the log1p transform. We also normalize the counts per each spot and only keep highly-variable genes (HVGs). All of these steps together constitute the standard single-cell RNA-seq preprocessing pipeline; see here for an example from Scanpy’s documentation.
Note that we merge the datasets together before computing the HVGs.
def transform_datasets(datasets, dataset_names):
    merged_dataset = ad.concat(datasets, label="batch", keys=dataset_names, merge="unique", uns_merge="unique")

    sc.pp.normalize_total(merged_dataset, inplace=True)
    sc.pp.log1p(merged_dataset)
    sc.pp.highly_variable_genes(merged_dataset, n_top_genes=500)
    merged_dataset.var.highly_variable

    transformed_datasets = []
    for dataset, name in zip(datasets, dataset_names):
        sc.pp.normalize_total(dataset, inplace=True)
        sc.pp.log1p(dataset)
        dataset = dataset[:, merged_dataset.var.highly_variable]
        transformed_datasets.append(PopariDataset(dataset, name))

    return transformed_datasets
transformed_datasets = transform_datasets(reformatted_datasets, dataset_names)
/home/shahula/bin/miniconda3/envs/spicemix_distribution/lib/python3.8/site-packages/anndata/_core/anndata.py:1828: UserWarning: Observation names are not unique. To make them unique, call `.obs_names_make_unique`.
  utils.warn_names_duplicates("obs")
/home/shahula/bin/miniconda3/envs/spicemix_distribution/lib/python3.8/site-packages/popari/_popari_dataset.py:25: FutureWarning: X.dtype being converted to np.float32 from float64. In the next version of anndata (0.9) conversion will not be automatic. Pass dtype explicitly to avoid this warning. Pass `AnnData(X, dtype=X.dtype, ...)` to get the future behavour.
  super().__init__(
Graph construction#
For Popari, we need an adjacency matrix describing which spots are neighbors of each other. We can call the compute_spatial_neighbors function from the PopariDataset object to construct this graph. This function uses Delaunay triangulation (with some filtering of large edges) to construct the graph.
for transformed_dataset in transformed_datasets:
    transformed_dataset.compute_spatial_neighbors()
Saving to disk#
save_anndata(data_directory / f"preprocessed_dataset.h5ad", transformed_datasets)
/home/shahula/bin/miniconda3/envs/spicemix_distribution/lib/python3.8/site-packages/anndata/_core/anndata.py:1828: UserWarning: Observation names are not unique. To make them unique, call `.obs_names_make_unique`.
  utils.warn_names_duplicates("obs")
AnnData object with n_obs × n_vars = 18558 × 500
    obs: 'n_genes_by_counts', 'total_counts', 'library_size', 'batch'
    uns: 'log1p', 'spatial_neighbors', 'adjacency_matrix'
    obsm: 'spatial'
Quality control (QC)#
Before running Popari, we must ensure that the preprocessing steps yielded the expected results.
from popari._dataset_utils import _plot_in_situ
from scipy.sparse import issparse
for dataset in transformed_datasets:
    sc.pp.calculate_qc_metrics(dataset, percent_top=None, log1p=False, inplace=True)
    dataset.obs["library_size"] = dataset.X.sum(axis=1)
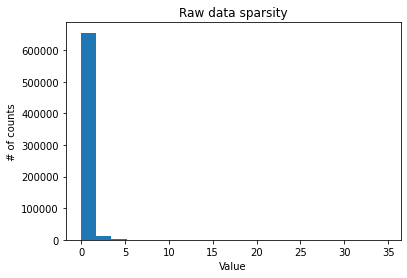
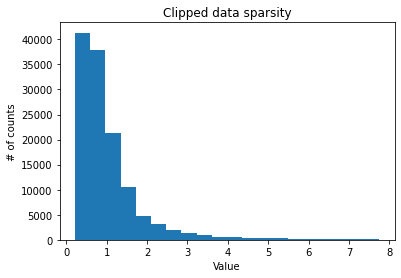
def plot_sparsity(dataset):
X = dataset.X
if issparse(X):
X = X.toarray()
raw_data = X.flatten()
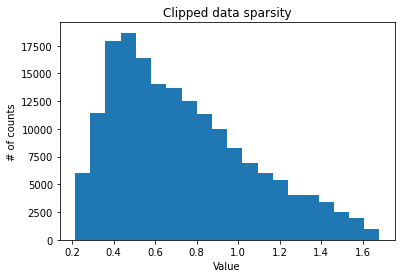
raw_data_clipped = raw_data
raw_data_clipped = raw_data_clipped[(raw_data_clipped > 1e-6) & (raw_data_clipped < np.percentile(raw_data_clipped, 99.9))]
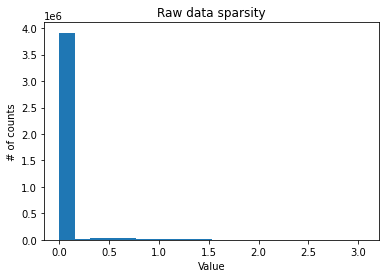
plt.title("Raw data sparsity")
plt.xlabel("Value")
plt.ylabel("# of counts")
plt.hist(raw_data, bins=20)
plt.show()
plt.figure()
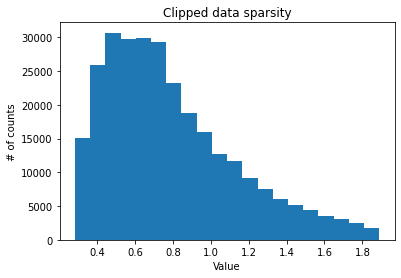
plt.title("Clipped data sparsity")
plt.xlabel("Value")
plt.ylabel("# of counts")
plt.hist(raw_data_clipped, bins=20)
plt.show()
sparsity = (raw_data == 0).sum() / raw_data.size
print(f"Raw data sparsity level: {sparsity}")
Metric plots#
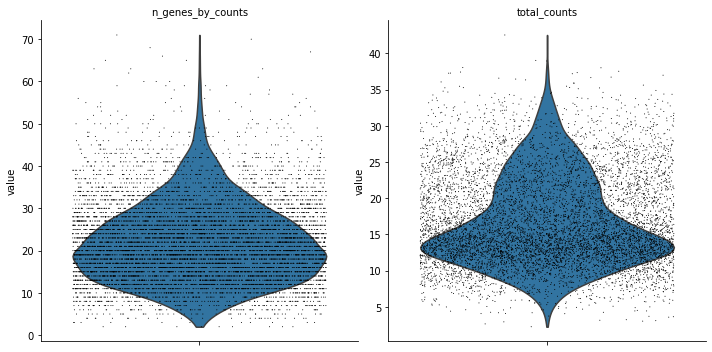
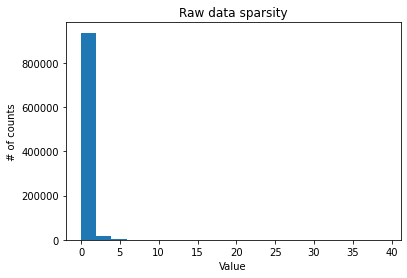
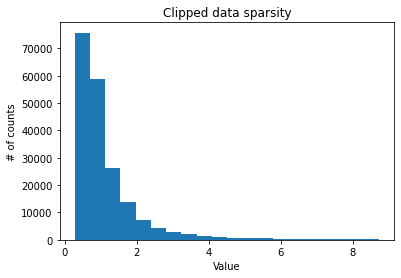
As revealed by the below plots, the data is very sparse.
for dataset in transformed_datasets:
print(dataset.name)
plot_sparsity(dataset)
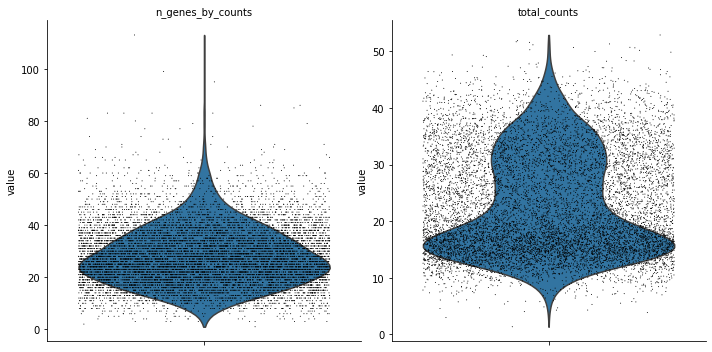
sc.pl.violin(dataset, ['n_genes_by_counts', 'total_counts'],
jitter=0.4, multi_panel=True)
eight_month
Raw data sparsity level: 0.9560845345712191
thirteen_month
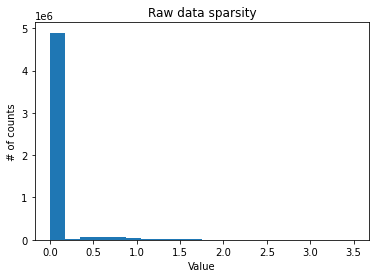
Raw data sparsity level: 0.9437981102969534
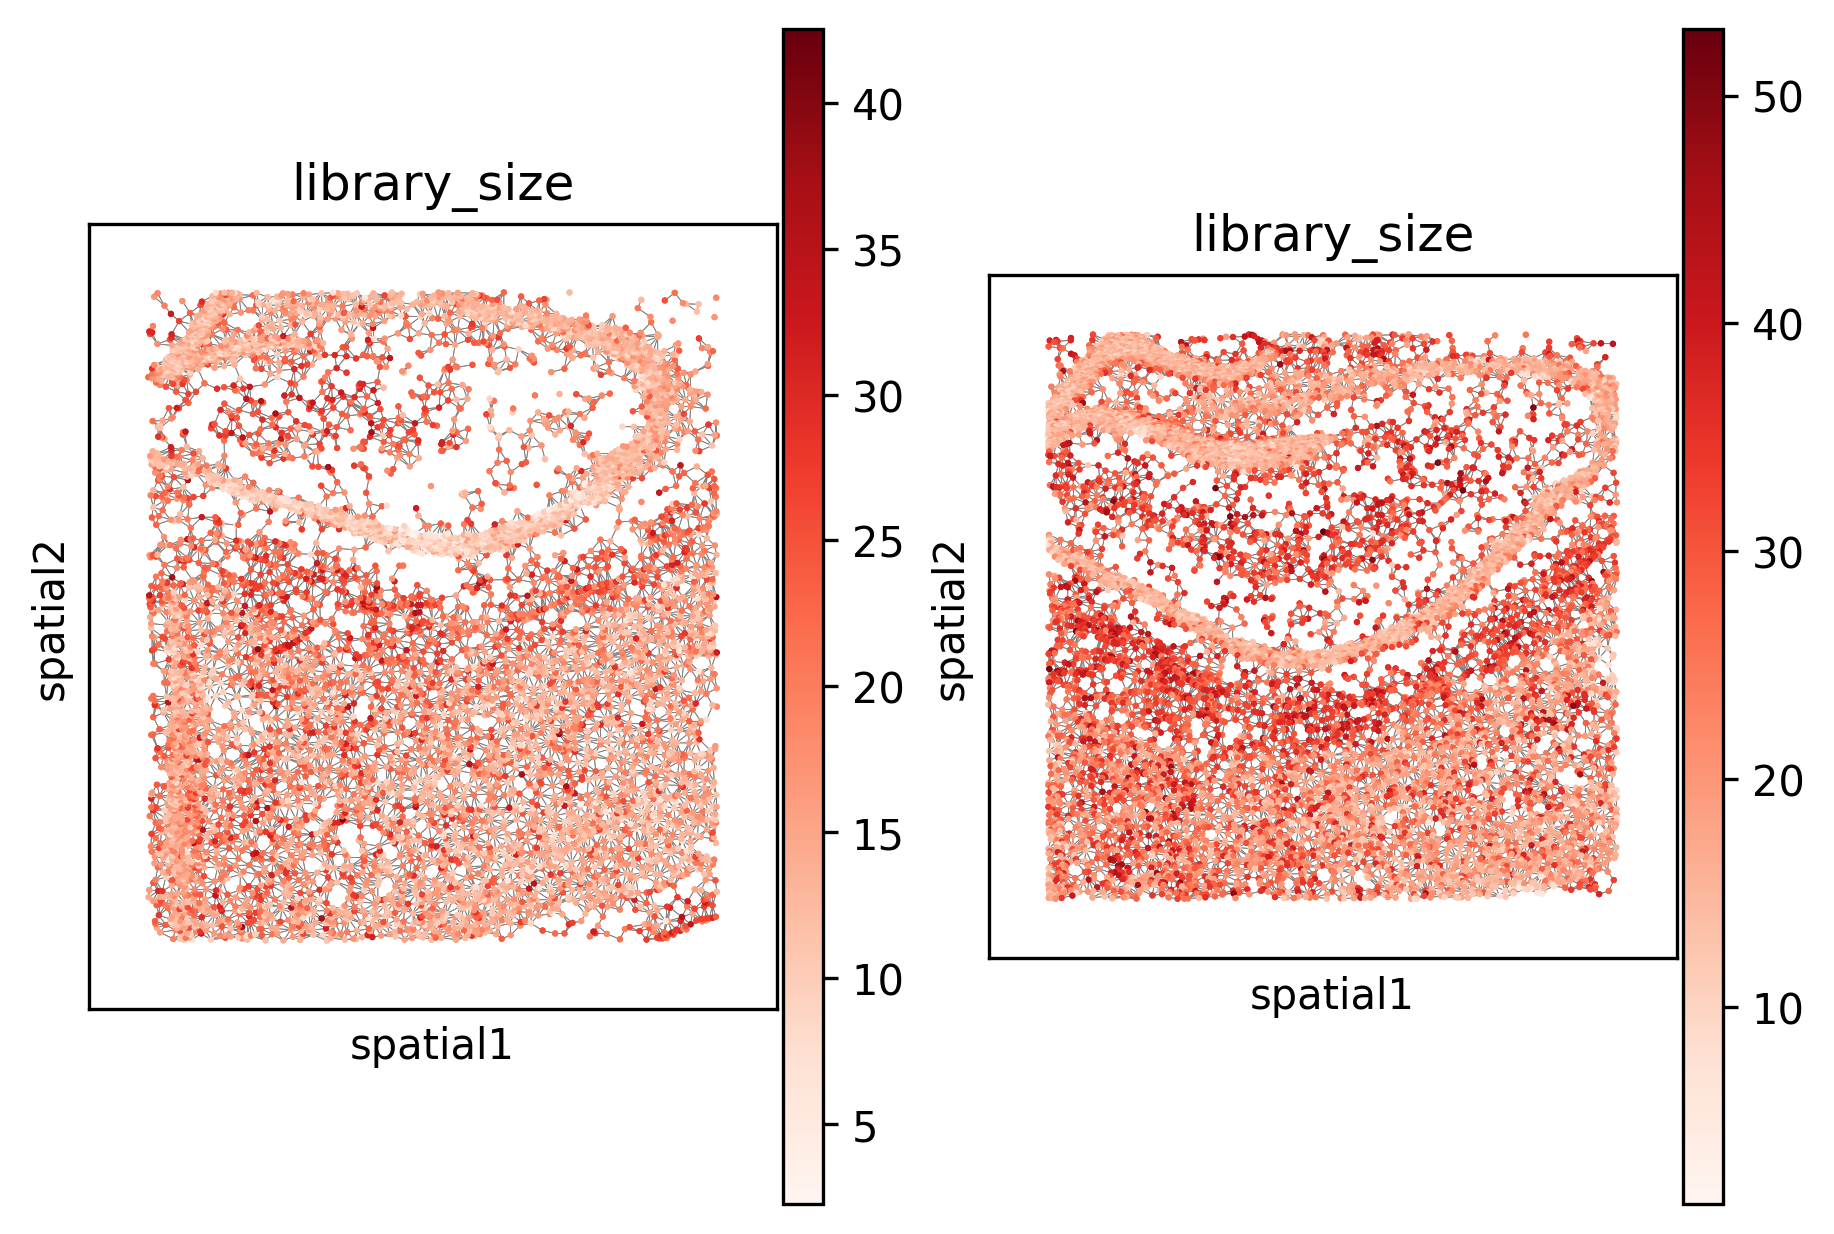
in situ plot#
Here we plot the spots (along with the spatial neighbor graph) in situ. Notice that the edges appear reasonable; however, we also see that the total number of preprocessed counts may be a confounding factor.
_ = _plot_in_situ(transformed_datasets, size=1, color="library_size", cmap="Reds")
WARNING: Please specify a valid `library_id` or set it permanently in `adata.uns['spatial']`
WARNING: Please specify a valid `library_id` or set it permanently in `adata.uns['spatial']`
Overcoming sparsity with spatial binning#
From the QC steps, we can see that there are some undesirable characteristics of the STARmap Plus data which may obscure important biological signals. One possible the issue is the inherent sparsity. We can combat this by spatially downsampling the data and combining spots into bins.
from popari._dataset_utils import _spatial_binning
binned_datasets = []
for dataset in transformed_datasets:
    binned_dataset = _spatial_binning(dataset, chunks=8, downsample_rate=0.2)
    print(f"Dataset downsampled from {len(dataset)} spots to {len(binned_dataset)} spots.")
    binned_datasets.append(binned_dataset)
/home/shahula/bin/miniconda3/envs/spicemix_distribution/lib/python3.8/site-packages/popari/_dataset_utils.py:704: FutureWarning: X.dtype being converted to np.float32 from float64. In the next version of anndata (0.9) conversion will not be automatic. Pass dtype explicitly to avoid this warning. Pass `AnnData(X, dtype=X.dtype, ...)` to get the future behavour.
  binned_dataset = ad.AnnData(X=filtered_bin_expression)
Dataset downsampled from 8186 spots to 1342 spots.
/home/shahula/bin/miniconda3/envs/spicemix_distribution/lib/python3.8/site-packages/popari/_dataset_utils.py:704: FutureWarning: X.dtype being converted to np.float32 from float64. In the next version of anndata (0.9) conversion will not be automatic. Pass dtype explicitly to avoid this warning. Pass `AnnData(X, dtype=X.dtype, ...)` to get the future behavour.
  binned_dataset = ad.AnnData(X=filtered_bin_expression)
Dataset downsampled from 10372 spots to 1924 spots.
for dataset in binned_datasets:
    print(dataset.name)
    plot_sparsity(dataset)
eight_month
Raw data sparsity level: 0.8113695976154992
thirteen_month
Raw data sparsity level: 0.7937463617463617
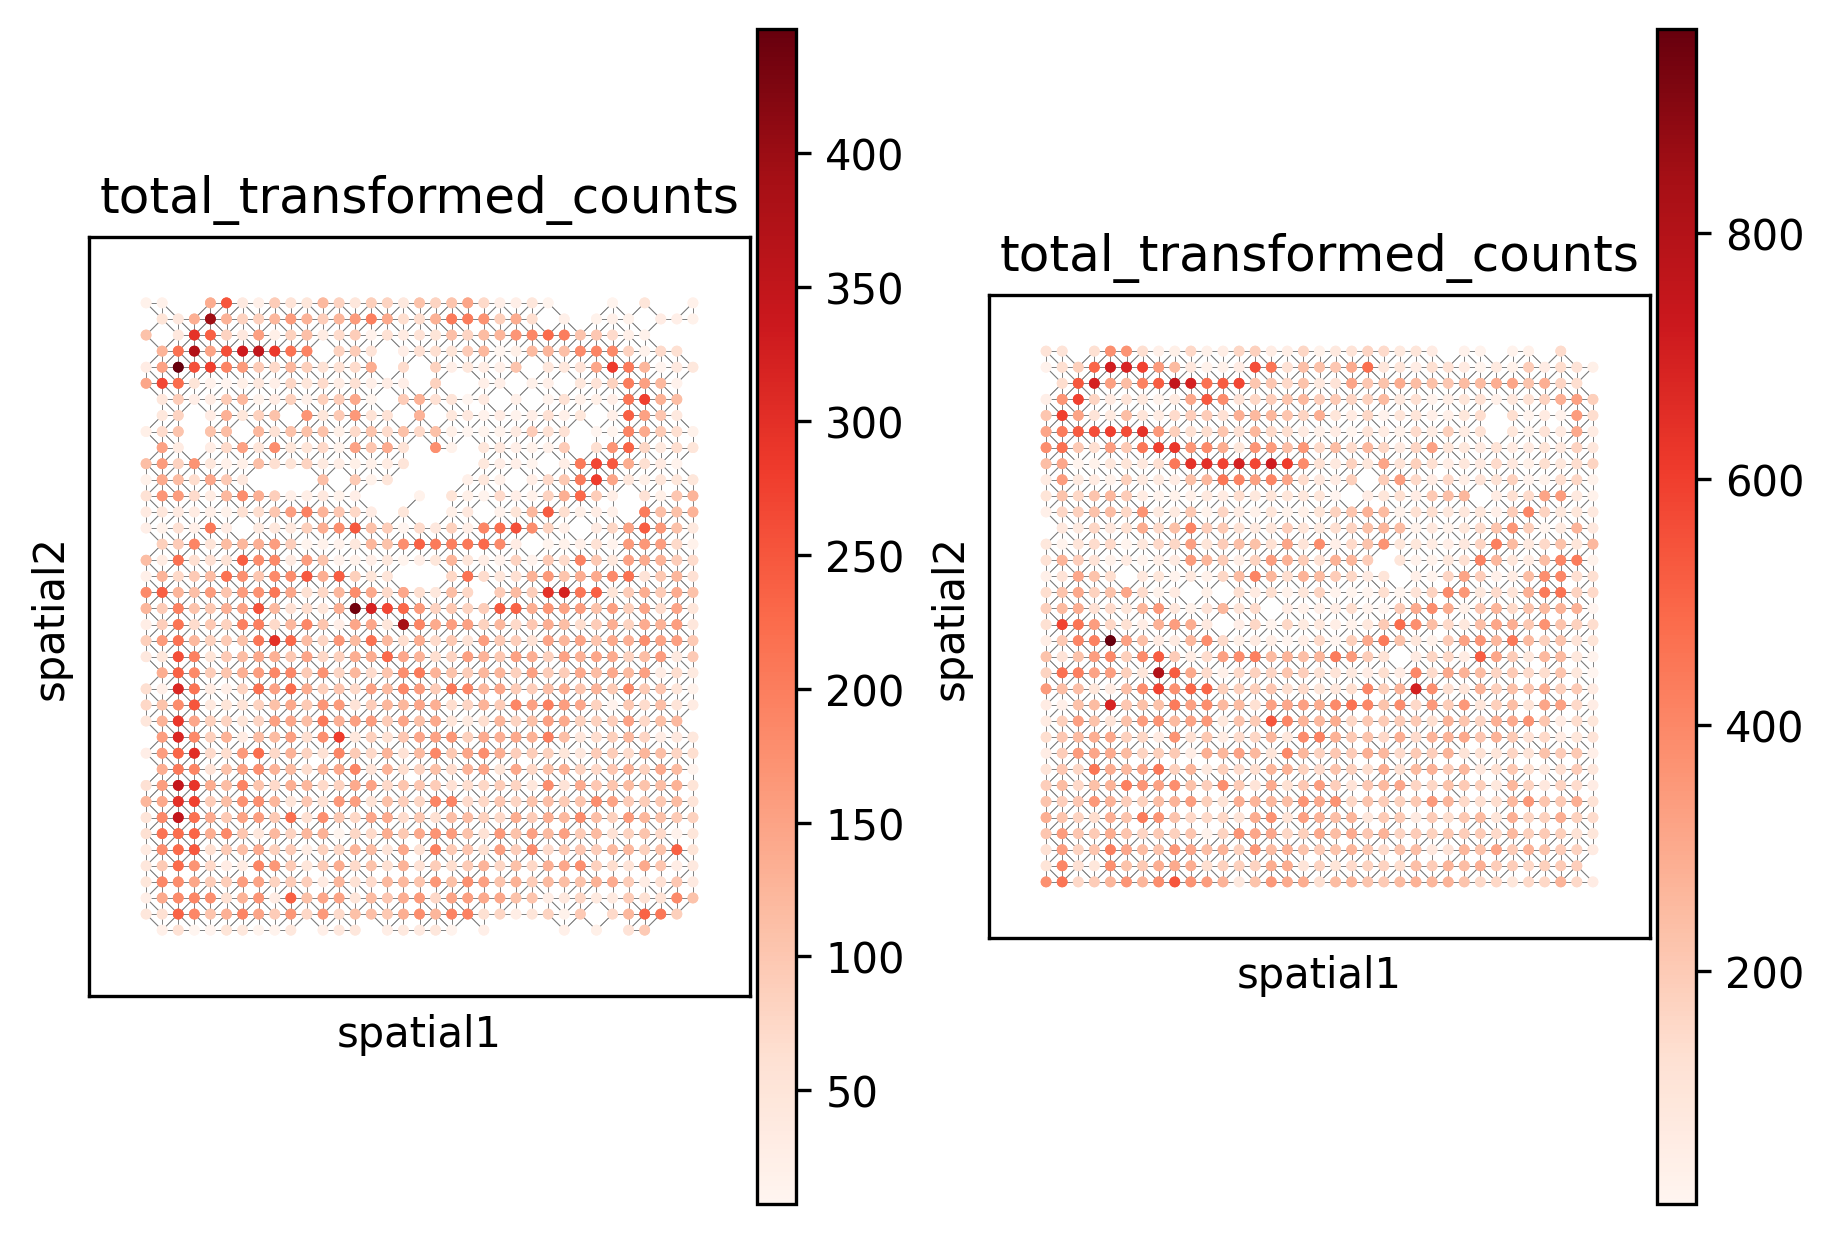
_ = _plot_in_situ(binned_datasets, size=10, color="total_transformed_counts", cmap="Reds")
WARNING: Please specify a valid `library_id` or set it permanently in `adata.uns['spatial']`
WARNING: Please specify a valid `library_id` or set it permanently in `adata.uns['spatial']`
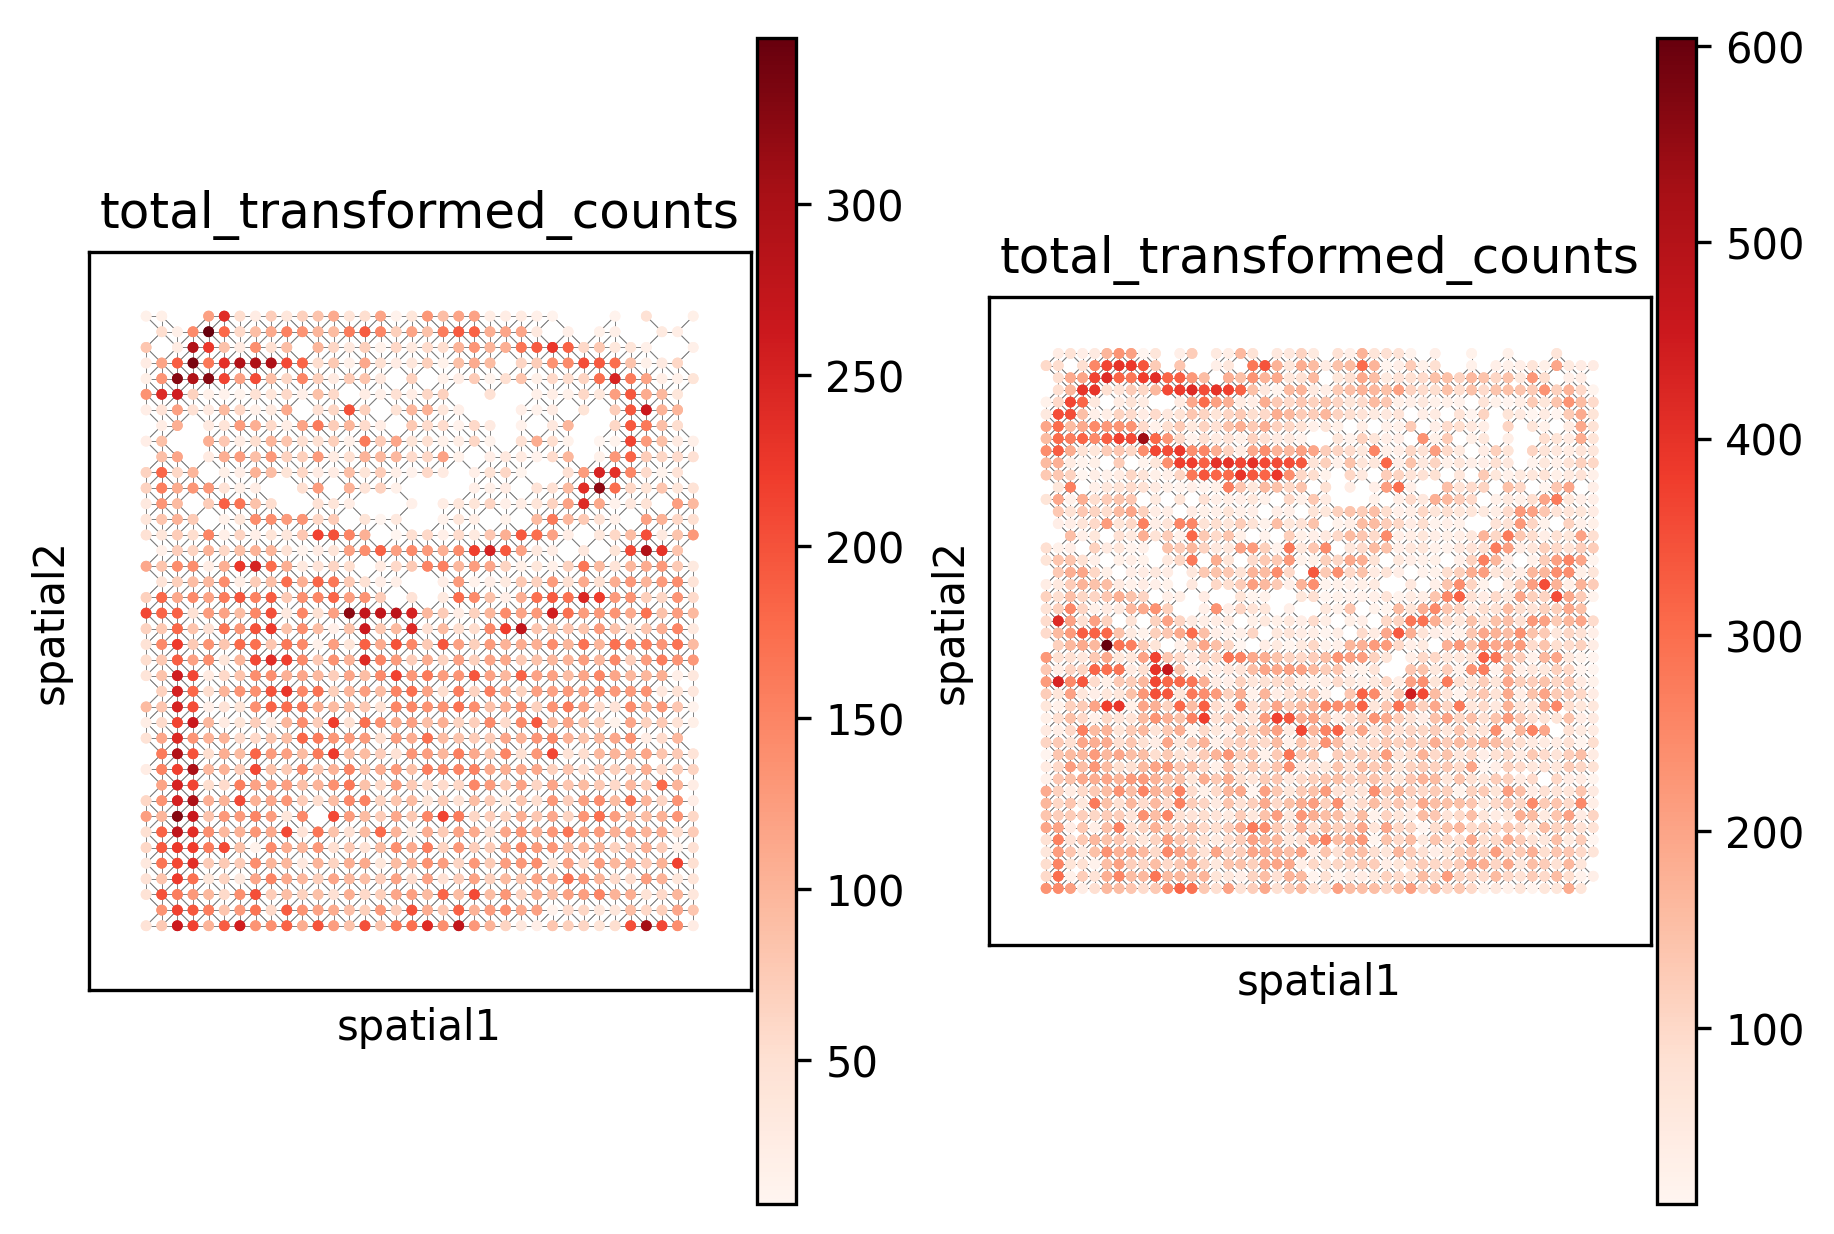
From the above plots, it is clear that binning significantly improves the sparsity of the data.
Using spatial binning with Popari#
To actually use spatial binning with Popari, set the hierarchical_levels parameter; this will automatically spatially bin your input data and initialize Popari parameters at multiple resolutions. Below is an example of how to do this.
import torch
from popari.model import Popari

K= 10
dataset_path = data_directory / f"preprocessed_dataset.h5ad"
context = {"device": "cuda:1", "dtype": torch.float64}
hierarchical_levels = 2

hierarchical_example = Popari(
    K=K,
    dataset_path=dataset_path,
    torch_context=context,
    initial_context=context,
    hierarchical_levels=hierarchical_levels
)
/home/shahula/bin/miniconda3/envs/spicemix_distribution/lib/python3.8/site-packages/anndata/_core/anndata.py:1828: UserWarning: Observation names are not unique. To make them unique, call `.obs_names_make_unique`.
  utils.warn_names_duplicates("obs")
/home/shahula/bin/miniconda3/envs/spicemix_distribution/lib/python3.8/site-packages/anndata/_core/anndata.py:1828: UserWarning: Observation names are not unique. To make them unique, call `.obs_names_make_unique`.
  utils.warn_names_duplicates("obs")
Current number of clusters: 9
Resolution: 1.0
Current number of clusters: 31
Resolution: 3.1622776601683795
Current number of clusters: 16
Resolution: 1.7782794100389228
Current number of clusters: 12
Resolution: 1.333521432163324
Current number of clusters: 10
Resolution: 1.1547819846894583
dict_keys(['eight_month', 'thirteen_month'])
[2023/05/22 16:48:10]	 Initializing hierarchy level 1
/home/shahula/bin/miniconda3/envs/spicemix_distribution/lib/python3.8/site-packages/popari/_dataset_utils.py:704: FutureWarning: X.dtype being converted to np.float32 from float64. In the next version of anndata (0.9) conversion will not be automatic. Pass dtype explicitly to avoid this warning. Pass `AnnData(X, dtype=X.dtype, ...)` to get the future behavour.
  binned_dataset = ad.AnnData(X=filtered_bin_expression)
[2023/05/22 16:48:10] Downsized dataset from 8186 to 1298 spots.
/home/shahula/bin/miniconda3/envs/spicemix_distribution/lib/python3.8/site-packages/popari/_dataset_utils.py:704: FutureWarning: X.dtype being converted to np.float32 from float64. In the next version of anndata (0.9) conversion will not be automatic. Pass dtype explicitly to avoid this warning. Pass `AnnData(X, dtype=X.dtype, ...)` to get the future behavour.
  binned_dataset = ad.AnnData(X=filtered_bin_expression)
[2023/05/22 16:48:11] Downsized dataset from 10372 to 1167 spots.
/home/shahula/bin/miniconda3/envs/spicemix_distribution/lib/python3.8/site-packages/anndata/_core/anndata.py:1828: UserWarning: Observation names are not unique. To make them unique, call `.obs_names_make_unique`.
  utils.warn_names_duplicates("obs")
Current number of clusters: 8
Resolution: 1.0
Current number of clusters: 25
Resolution: 3.1622776601683795
Current number of clusters: 15
Resolution: 1.7782794100389228
Current number of clusters: 13
Resolution: 1.333521432163324
Current number of clusters: 10
Resolution: 1.1547819846894583
dict_keys(['eight_month', 'thirteen_month'])
_ = _plot_in_situ(hierarchical_example.hierarchy[1].datasets, size=10, color="total_transformed_counts", cmap="Reds")
WARNING: Please specify a valid `library_id` or set it permanently in `adata.uns['spatial']`
WARNING: Please specify a valid `library_id` or set it permanently in `adata.uns['spatial']`